In the present work, a fault evaluation method for photovoltaic arrays based on fault parameters identification and curves analysis is proposed for diagnosing the state of photovoltaic generators. An overview of the components, the modelling of the photovoltaic generator and the meaning of the parameters is established for relating parameters to photovoltaic components and environmental conditions. The analysis and investigation of the relationship between the maximum power points and the parameters variations are performed. Investigation on how degradations and failure on photovoltaic systems can affect parameters, is established. In this context, the methodology for diagnosing and monitoring defects based on photovoltaic estimated parameters is developed; the optimization technique maximum likelihood, is used for extracting health and faults parameters from the measured curves of the photovoltaic array. From residual vectors, the parameters which vary more are the series resistance, the shunt resistor, and the current of photon. The maximum power also changes and decreases from its reference value. The validation results prove deviations on parameters, which means that there are degradations and failures on the ARCO Solar M75 array after 20 years of outdoors operation. So, at the end of this analysis, it is recommended to act on the PV system through junction box, cell edges, wiring, busbars, and connectors.
| Published in | International Journal of Sustainable and Green Energy (Volume 13, Issue 4) |
| DOI | 10.11648/j.ijrse.20241304.11 |
| Page(s) | 67-81 |
| Creative Commons |
This is an Open Access article, distributed under the terms of the Creative Commons Attribution 4.0 International License (http://creativecommons.org/licenses/by/4.0/), which permits unrestricted use, distribution and reproduction in any medium or format, provided the original work is properly cited. |
| Copyright |
Copyright © The Author(s), 2024. Published by Science Publishing Group |
Parameter Estimation, Curves Analysis, PV Module, Degradations, Failure, Maximum Likelihood Estimator (MLE), Fault Diagnosis
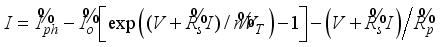
 (1)
(1)  ), the saturation current (
  ); the series resistance (
  ); the shunt resistance (
  ), and the diode ideality factor (
  ). It is necessary to know how these parameters are part of the external and the internal components of the PV generator.
  of the PV generator represents the sum of the resistances contributed by all of the series-connected cell layers, the interconnect bus-bars contacts, the resistances in junction-box terminations and the wiring between both ends of the system’s circuit
  , is caused by any parallel high-conductivity paths (shunts) through the solar cell or on the cell edges
  expresses the degree of ideality of the diodes incorporated in the PV generator. Usually,
  and the choice depends on other parameters of the (I-V) model.
  expresses the saturation current of the diode of the PV generator. It depends mainly on temperature
  expresses the current generated directly by irradiation on the PV generator. The photo current
  at the STC is related to the short circuit current
  at the STC, by the following expression
  (2)
(2)  (3)
(3)  ,
,  (4)
(4) Degradations | Front surface soiling | Optical degradation or discoloration of the encapsulating material | Degradation of anti-reflection (AR) coating | Light induced degradation | Corrosion and temperature induced degradation |
|---|---|---|---|---|---|
Causes | Dirt accumulation on the module’s | -UV exposure - Elevated temperature and humidity -Diffusion of dirt and moisture ingress -Browning, yellowing and whiting of EVA layer | - Inter diffusion of species from cell’s emitter region to the AR coating and vice versa - Manufacturer defects | Broken bonds by energy release during recombination of electron hole pairs | Elevated modules temperature decrease |
Types of failures if there is no protection. | -Partial shade - Hot spot damage - Mismatched cell/module/array | - Partial shade - Hot spot damage - Mismatched cell/module/array - Module delamination | - Cells degradation - Mismatched cell/module/array | -Meta stable defects -Material deterioration - Module delamination -Cell degradation | - Thermal stress -Material deterioration - Module delamination -Cell degradation |
Effects on Pmax and on parameters | -Pmax and FF drops -Isc and Iph decrease -Unknown effects on Io,Rs,Rp,n | -Pmax and FF drops -Isc and Iph decrease -Unknown effects on Io,Rs,Rp,n | -Pmax and FF drops -Isc and Iph decrease -Voc decrease -Unknown effects on Io,Rs,Rp,n | -Pmax and FF drops -Isc and Iph decrease -Voc decrease -Rp decrease -Rs increase -Unknown effects on Io,n | -Pmax and FF drops -Isc and Iph slightly increase -Voc decrease -Rp decrease -Rs increase - n decrease - Io decrease |
Protection actions | -Regular cleaning - Use of bypass diodes | -Use of stabilizer and anti-oxidants -Use of bypass diodes | - Texturing the surface - Adding AR coating -Use of bypass diodes | Use of bypass diodes | Use of bypass diodes |
Adapted diagnosis, detection methods | -Visual inspection -Evaluation of residual generator and monitoring Isc,Io,Rs,Rp,n,Voc - (I-V) curves data measurements and analysis -Preventive and predictive maintenances | -Visual inspection -Evaluation of residual generator and monitoring Isc,Io,Rs,Rp,n,Voc - (I-V) curves data measurements and analysis -Preventive and predictive maintenances | - Visual inspection - Evaluation of residual generator and monitoring Isc,Io,Rs,Rp,n,Voc - (I-V) curves data measurements and analysis -Preventive and predictive maintenances | - Visual inspection -Evaluation of residual generator and monitoring Isc,Io,Rs,Rp,n,Voc - (I-V) curves data measurements and analysis -Preventive and predictive maintenances | - Visual inspection - Evaluation of residual generator and monitoring Isc,Io,Rs,Rp,n,Voc - (I-V) curves data measurements and analysis -Preventive and predictive maintenances |
Failures | Cells degradations | Short circuit cell/modules | Interconnect open circuit cells/modules | Module glass breakage and cracking cell | Bypass diode failure | Hot spot failure | Module delamination | Ground faults | Mismatched cell/modules |
|---|---|---|---|---|---|---|---|---|---|
Causes | -Light induced degradation -Temperature induced degradation -AR coating degradation | -Manufacturers’ defects - Discolouration of the encapsulating material | -Damage during installation -Temperature degradation by thermal stress -Manufacturer's defects -Wind load | -Damage during installation -Temperature degradation by thermal stress -Manufacturers defects. -Wind load | -Overheating -Manufacturers defects | -Mismatched cell by front surface soiling Temperature degradation by thermal stress -Partial shade -manufacturers defects | -Hight temperature in mismatched cell -Front soiling surface -Moisture and thermal expansion -Shaded cell -manufacturers defects | -isolation of cabling isolation of junction box Connection within PV array-leakage currents | -Front surface soiling -Encapsuling degradation -Hot spot -AR coating deterioration -Partial shading manufacturers defects |
Effects on Pmax and on parameters | -Pmax and FF drops -Isc and Iph slightly increase -Voc decrease -Rp decrease -Rs increase - n decrease - Io decrease | -Pmax and FF drops -Isc and Iph slightly increase -Voc decrease -Rp decrease -Rs increase - n decrease - Io decrease | -Pmax and FF drops -Isc and Iph decrease -Rs increase -Unknown effects on Io,Rp, n | -Pmax and FF drops -Isc and Iph decrease -Unknown effects on Io,Rs,Rp, n | -Pmax and FF drops -Isc and Iph decrease -Unknown effects on Io,Rs,Rp, n | -Pmax and FF drops -Isc and Iph decrease -Unknown effects on Io,Rs,Rp, n | -Pmax and FF drops -Unknown effects on Isc,Io,Rs,Rp, n | -Pmax and FF drops -Isc and Iph decrease -Rs increase -Unknown effects on Io,Rp, n | -Pmax and FF drops -Isc and Iph decrease -Voc decrease -Unknown effects on Io,Rs,Rp,n |
Adapted diagnosis, detection methods | -Visual inspection -thermal camera - (I-V) curves data measurements and analysis -Evaluation of residual generator and monitoring Isc,Io,Rs,Rp,n,Voc | -Visual inspection - (I-V) curves data measurements and analysis -Evaluation of residual generator and monitoring Isc,Io,Rs,Rp,n, Voc | -Visual inspection -thermal camera - (I-V) curves data measurements and analysis -Evaluation of residual generator and monitoring Isc,Io,Rs,Rp,n,Voc | -Visual inspection -thermal camera - (I-V) curves data measurements and analysis -Evaluation of residual generator and monitoring Isc,Io,Rs,Rp,n, Voc | -Visual inspection - (I-V) curves data measurements and analysis -Evaluation of residual generator and monitoring Isc,Io,Rs,Rp,n,Voc | -Visual inspection -thermal camera -hot spot endurance testing-individual cell temperature monitoring - (I-V) curves data measurements and analysis -Evaluation of residual generator and monitoring Isc,Io,Rs,Rp,n,Voc | -Visual inspection - (I-V) curves data measurements and analysis -Evaluation of residual generator and monitoring Isc,Io,Rs,Rp,n,Voc | -Visual inspection - (I-V) curves data measurements and analysis -Evaluation of residual generator and monitoring Isc,Io,Rs,Rp,n,Voc | -Visual inspection -thermal camera -hot spot endurance testing-individual cell temperature monitoring - (I-V) curves data measurements and analysis -Evaluation of residual generator and monitoring Isc,Io,Rs,Rp,n,Voc |
 (5)
(5)  ;
;  ;
;  ;
;  ;
;  .
.  ,
,  ,
,  ,
,  ,
,  denote changes or deviations of the parameters (
  ,
,  ,
,  ,
,  ,
,  ). The vector
  is defined as the residual vector of the parameters’ variations.
  that maximizes the joint probability,
  , that is equal to the actual measurements
  . It is also equivalent to the vector that minimizes the cost function (16) adapted for parameters estimation with process and measurement noise.
 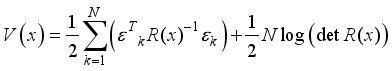 (6)
(6)  are those that satisfy following equation:
 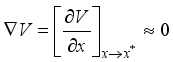 (7)
(7)  represents the cost function gradient, where
 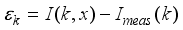 and
and 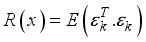 .
.  is the innovation sequence. It is also the residue or error in the current prediction at known voltages.
  is the corresponding measurement noise covariance matrix.
  denote the number of experimental measures.
 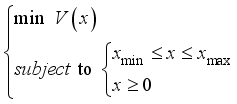 (8)
(8)  (9)
(9)  and
and  are the upper and the lower bounds of the parameter vector
  , respectively.
  as mentioned by (15), and on the comparison between the measured (I-V) or (P-V) curves and the ones simulated from the estimated parameters.
  and the measured and estimated (P-V) curves are quite the same, then there are no anomalies in the PV generator. No faults are detected; the five parameters are stored to develop a long-term diagnostic analysis. If
  and the measured and estimated (P-V) curves are different, a fault is detected. Then the estimated five parameters are not stored, and a short-term diagnostic procedure can be launched to identify the location and the type of the fault. Once the defects have been detected, the residual vector must be analyzed to know exactly the parameters which are not the same as the reference parameters; referring to section 2, this step makes it possible to locate the components that may be affected by these defects. Once the components (supposed faulty) located, it is necessary to evaluate the defects. This assessment allows us to know if the defects are majors or not; for major faults, it is important to go to a decision-making process to take corrective measures for avoiding a complete shutdown of the system. For minor faults, predictive or preventive maintenance must be carried out to anticipate more serious faults by using some protection methods.
 Parameter | Rs (ohm) | Rp (ohm) | Iph (A) | Io (A) | n |
|---|---|---|---|---|---|
Initial value | 0.01 | 20 | 3 | 10-11 | 1 |
Search range | 0.005-0.7 | 20-600 | 2-4 | 10-13-10-8 | 1-2 |
Parameters | Iph(A) | Io(A) | n | Rs(Ω) | Rp(Ω) | Isc (A) | Voc (V) | Pmax (W) | |
|---|---|---|---|---|---|---|---|---|---|
MLE | 1990 | 3.299 | 10-8 | 1.036 | 0.3 | 114.601 | 3.282 | 18.3 | 41.73 |
2001 | 3.495 | 10-8 | 1.020 | 0.328 | 25.630 | 3.449 | 18.01 | 39.43 | |
2010 | 2.987 | 10-8 | 1.048 | 0.385 | 20.000 | 2.504 | 18 | 30.84 | |
% /residual/ 1990-2001 | 5.94 | 0 | 1.54 | 44.5 | 77.63 | 5.08 | 1.58 | 5.51 | |
% /residual/ 2001-2010 | 14.53 | 0 | 2.74 | 19.51 | 21.96 | 27.39 | 0.055 | 21.78 | |
% /residual/ 1990-2010 | 9.45 | 0 | 1.15 | 34.96 | 82.54 | 23.70 | 1.63 | 26.09 | |
Comments | Increase slightly and then decrease | constant | Decrease slightly and then increase | Increase slightly | decrease | Increase slightly and then decrease | decrease | decrease | |
 .
.
| Photovoltaic |
| Current |
| Voltage |
| Power |
| Photocurrent of PV Module/Array |
| Photocurrent of PV Module/Array at Reference Temperature |
| Saturation current of PV Module/Array |
| Saturation current of PV Module/Array at Reference Temperature |
| Thermal Voltage of a Photovoltaic Module/Array |
| Thermal Voltage of a Photovoltaic Module/Array at Reference Temperature |
| The Diode Ideality Factor for a p-n Junction in a Cell |
| The Electron Charge ( |
| Boltzmann Constant ( |
| The Absolute Temperature of the Module/Array |
| Maximum Current |
| Maximum Voltage |
| Experimental Maximum Power |
| Short Circuit Current |
| Short Circuit Current at Reference Temperature |
| Open Circuit Voltage |
| Open Circuit Voltage at Reference Temperature |
| Temperature Coefficient of Voltage |
| Temperature Coefficient of Current |
| Optimal Solution |
STC | Standard Test Conditions |
NOCT | Nominal Operating Condition Test |
MLE | Maximum Likelihood Estimator |
UV | Ultra Violet |
FF | Fill Factor |
EVA | Ethylene Vinyl Acetate |
| [1] | S. Weckend, A. Wade, and G. Heath, "End-of-life management: Solar photovoltaic panels," National Renewable Energy Lab. (NREL), Golden, CO (United States), 2016. |
| [2] | D. C. Jordan and S. R. Kurtz, "Photovoltaic degradation rates—an analytical review," Progress in photovoltaics: Research and Applications, vol. 21, no. 1, pp. 12-29, 2013. |
| [3] | D. Jordan, Methods of Analysis of Outdoor Performance Data. National Renewable Energy Laboratory, 2011. |
| [4] | P. Ducange, M. Fazzolari, B. Lazzerini, and F. Marcelloni, "An intelligent system for detecting faults in photovoltaic fields," in 2011 11th International Conference on Intelligent Systems Design and Applications, 2011: IEEE, pp. 1341-1346. |
| [5] | M. Davarifar, A. Rabhi, A. El-Hajjaji, and M. Dahmane, "Real-time model base fault diagnosis of PV panels using statistical signal processing," in Renewable Energy Research and Applications (ICRERA), 2013 International Conference on, 2013: IEEE, pp. 599-604. |
| [6] | S. K. Firth, K. J. Lomas, and S. J. Rees, "A simple model of PV system performance and its use in fault detection," Solar Energy, vol. 84, no. 4, pp. 624-635, 2010. |
| [7] | A. Chouder and S. Silvestre, "Automatic supervision and fault detection of PV systems based on power losses analysis," Energy conversion and Management, vol. 51, no. 10, pp. 1929-1937, 2010. |
| [8] | J. Solórzano and M. Egido, "Automatic fault diagnosis in PV systems with distributed MPPT," Energy conversion and management, vol. 76, pp. 925-934, 2013. |
| [9] | M. A. Ramli, S. Twaha, K. Ishaque, and Y. A. Al-Turki, "A review on maximum power point tracking for photovoltaic systems with and without shading conditions," Renewable and Sustainable Energy Reviews, vol. 67, pp. 144-159, 2017. |
| [10] | A. Ayang et al., "Maximum likelihood parameters estimation of single-diode model of photovoltaic generator," Renewable energy, vol. 130, pp. 111-121, 2019. |
| [11] | A. Ayang, R. Wamkeue, M. Ouhrouche, and B. H. Malwe, "Maximum Likelihood Parameters Estimation Of Single-Diode Photovoltaic Module/Array: A Comparative Study At STC," in 2018 IEEE Electrical Power and Energy Conference (EPEC), 2018: IEEE, pp. 1-6. |
| [12] | J. Zoellick, "Testing and matching photovoltaic modules to maximize solar electric array performance “," Senior project presented to the Department of Environmental Resources Engineering Humboldt State University, 1990. |
| [13] | A. M. Reis, N. T. Coleman, M. W. Marshall, P. A. Lehman, and C. E. Chamberlin, "Comparison of PV module performance before and after 11-years of field exposure," in Photovoltaic Specialists Conference, 2002. Conference Record of the Twenty-Ninth IEEE, 2002: IEEE, pp. 1432-1435. |
| [14] | C. Chamberlin, M. Rocheleau, M. Marshall, A. Reis, N. Coleman, and P. Lehman, "Comparison of PV module performance before and after 11 and 20 years of field exposure," in Photovoltaic Specialists Conference (PVSC), 2011 37th IEEE, 2011: IEEE, pp. 000101-000105. |
| [15] | K. Park, G. Kang, H. Kim, G. Yu, and J. Kim, "Analysis of thermal and electrical performance of semi-transparent photovoltaic (PV) module," Energy, vol. 35, no. 6, pp. 2681-2687, 2010. |
| [16] | M. AlRashidi, M. AlHajri, K. El-Naggar, and A. Al-Othman, "A new estimation approach for determining the I–V characteristics of solar cells," Solar Energy, vol. 85, no. 7, pp. 1543-1550, 2011. |
| [17] | S. R. Wenham, Applied photovoltaics. Routledge, 2012. |
| [18] | S. Chattopadhyay et al., "Visual degradation in field-aged crystalline silicon PV modules in India and correlation with electrical degradation," IEEE Journal of photovoltaics, vol. 4, no. 6, pp. 1470-1476, 2014. |
| [19] | E. Kaplani, "Detection of degradation effects in field-aged c-Si solar cells through IR thermography and digital image processing," International Journal of Photoenergy, vol. 2012, 2012. |
| [20] | M. G. Villalva, J. R. Gazoli, and E. Ruppert Filho, "Modeling and circuit-based simulation of photovoltaic arrays," in 2009 Brazilian Power Electronics Conference, 2009: IEEE, pp. 1244-1254. |
| [21] | S. Alem-Boudjemline, "réalisation et caractérisation de cellules photovoltaïques plastiques," 2004. |
| [22] | M. Green, "Solar cells: operating principles, technology, and system applications. University of New South Wales, Kensington," New South Wales, Australia, pp. 96-97, 1992. |
| [23] | S. Kadry, Diagnostics and Prognostics of Engineering Systems: Methods and Techniques: Methods and Techniques. IGI Global, 2012. |
| [24] | F. Almonacid, C. Rus, P. Pérez-Higueras, and L. Hontoria, "Calculation of the energy provided by a PV generator. Comparative study: conventional methods vs. artificial neural networks," Energy, vol. 36, no. 1, pp. 375-384, 2011. |
| [25] | M. Munoz, M. C. Alonso-García, N. Vela, and F. Chenlo, "Early degradation of silicon PV modules and guaranty conditions," Solar energy, vol. 85, no. 9, pp. 2264-2274, 2011. |
| [26] | V. Sharma and S. Chandel, "Performance and degradation analysis for long term reliability of solar photovoltaic systems: a review," Renewable and Sustainable Energy Reviews, vol. 27, pp. 753-767, 2013. |
| [27] | A. Charki, R. Laronde, and D. Bigaud, "The time-variant degradation of a photovoltaic system," Journal of Solar Energy Engineering, vol. 135, no. 2, p. 024503, 2013. |
| [28] | J. Wohlgemuth, D. W. Cunningham, A. Nguyen, G. Kelly, and D. Amin, "Failure modes of crystalline Si modules," in PV Module Reliability Workshop, 2010. |
| [29] | A. Ndiaye, A. Charki, A. Kobi, C. M. Kébé, P. A. Ndiaye, and V. Sambou, "Degradations of silicon photovoltaic modules: A literature review," Solar Energy, vol. 96, pp. 140-151, 2013. |
| [30] | J. H. Wohlgemuth and S. Kurtz, "Reliability testing beyond qualification as a key component in photovoltaic's progress toward grid parity," in 2011 International Reliability Physics Symposium, 2011: IEEE, pp. 5E. 3.1-5E. 3.6. |
| [31] | M. K. Al-Smadi and Y. Mahmoud, "Analysis of Photovoltaic Systems Power Losses in Partial Shading Conditions," in IECON 2018-44th Annual Conference of the IEEE Industrial Electronics Society, 2018: IEEE, pp. 1699-1704. |
| [32] | D. S. Pillai and N. Rajasekar, "A comprehensive review on protection challenges and fault diagnosis in PV systems," Renewable and Sustainable Energy Reviews, vol. 91, pp. 18-40, 2018. |
| [33] | S. R. Madeti and S. Singh, "A comprehensive study on different types of faults and detection techniques for solar photovoltaic system," Solar Energy, vol. 158, pp. 161-185, 2017. |
| [34] | A. Triki-Lahiani, A. B.-B. Abdelghani, and I. Slama-Belkhodja, "Fault detection and monitoring systems for photovoltaic installations: A review," Renewable and Sustainable Energy Reviews, vol. 82, pp. 2680-2692, 2018. |
| [35] | A. Mellit, G. M. Tina, and S. A. Kalogirou, "Fault detection and diagnosis methods for photovoltaic systems: A review," Renewable and Sustainable Energy Reviews, vol. 91, pp. 1-17, 2018. |
APA Style
Ayang, A., Goron, D., Mbakop, F. K., Yaouba. (2024). Parameters Estimation and Curves Analysis for Faults Evaluation of a Degraded Photovoltaic Module. International Journal of Sustainable and Green Energy, 13(4), 67-81. https://doi.org/10.11648/j.ijrse.20241304.11
ACS Style
Ayang, A.; Goron, D.; Mbakop, F. K.; Yaouba. Parameters Estimation and Curves Analysis for Faults Evaluation of a Degraded Photovoltaic Module. Int. J. Sustain. Green Energy 2024, 13(4), 67-81. doi: 10.11648/j.ijrse.20241304.11
AMA Style
Ayang A, Goron D, Mbakop FK, Yaouba. Parameters Estimation and Curves Analysis for Faults Evaluation of a Degraded Photovoltaic Module. Int J Sustain Green Energy. 2024;13(4):67-81. doi: 10.11648/j.ijrse.20241304.11
@article{10.11648/j.ijrse.20241304.11,
  author = {Albert Ayang and Deli Goron and Fabrice Kwefeu Mbakop and Yaouba},
  title = {Parameters Estimation and Curves Analysis for Faults Evaluation of a Degraded Photovoltaic Module
},
  journal = {International Journal of Sustainable and Green Energy},
  volume = {13},
  number = {4},
  pages = {67-81},
  doi = {10.11648/j.ijrse.20241304.11},
  url = {https://doi.org/10.11648/j.ijrse.20241304.11},
  eprint = {https://article.sciencepublishinggroup.com/pdf/10.11648.j.ijrse.20241304.11},
  abstract = {In the present work, a fault evaluation method for photovoltaic arrays based on fault parameters identification and curves analysis is proposed for diagnosing the state of photovoltaic generators. An overview of the components, the modelling of the photovoltaic generator and the meaning of the parameters is established for relating parameters to photovoltaic components and environmental conditions. The analysis and investigation of the relationship between the maximum power points and the parameters variations are performed. Investigation on how degradations and failure on photovoltaic systems can affect parameters, is established. In this context, the methodology for diagnosing and monitoring defects based on photovoltaic estimated parameters is developed; the optimization technique maximum likelihood, is used for extracting health and faults parameters from the measured curves of the photovoltaic array. From residual vectors, the parameters which vary more are the series resistance, the shunt resistor, and the current of photon. The maximum power also changes and decreases from its reference value. The validation results prove deviations on parameters, which means that there are degradations and failures on the ARCO Solar M75 array after 20 years of outdoors operation. So, at the end of this analysis, it is recommended to act on the PV system through junction box, cell edges, wiring, busbars, and connectors.
},
 year = {2024}
}
TY  - JOUR
T1  - Parameters Estimation and Curves Analysis for Faults Evaluation of a Degraded Photovoltaic Module

AU  - Albert Ayang
AU  - Deli Goron
AU  - Fabrice Kwefeu Mbakop
AU  - Yaouba
Y1  - 2024/11/18
PY  - 2024
N1  - https://doi.org/10.11648/j.ijrse.20241304.11
DO  - 10.11648/j.ijrse.20241304.11
T2  - International Journal of Sustainable and Green Energy
JF  - International Journal of Sustainable and Green Energy
JO  - International Journal of Sustainable and Green Energy
SP  - 67
EP  - 81
PB  - Science Publishing Group
SN  - 2575-1549
UR  - https://doi.org/10.11648/j.ijrse.20241304.11
AB  - In the present work, a fault evaluation method for photovoltaic arrays based on fault parameters identification and curves analysis is proposed for diagnosing the state of photovoltaic generators. An overview of the components, the modelling of the photovoltaic generator and the meaning of the parameters is established for relating parameters to photovoltaic components and environmental conditions. The analysis and investigation of the relationship between the maximum power points and the parameters variations are performed. Investigation on how degradations and failure on photovoltaic systems can affect parameters, is established. In this context, the methodology for diagnosing and monitoring defects based on photovoltaic estimated parameters is developed; the optimization technique maximum likelihood, is used for extracting health and faults parameters from the measured curves of the photovoltaic array. From residual vectors, the parameters which vary more are the series resistance, the shunt resistor, and the current of photon. The maximum power also changes and decreases from its reference value. The validation results prove deviations on parameters, which means that there are degradations and failures on the ARCO Solar M75 array after 20 years of outdoors operation. So, at the end of this analysis, it is recommended to act on the PV system through junction box, cell edges, wiring, busbars, and connectors.

VL  - 13
IS  - 4
ER  -
Department of Renewable Energy, National Advance School of Engineering of Maroua, University of Maroua, Maroua, Cameroon
Department of Renewable Energy, National Advance School of Engineering of Maroua, University of Maroua, Maroua, Cameroon
Department of Renewable Energy, National Advance School of Engineering of Maroua, University of Maroua, Maroua, Cameroon
Department of Renewable Energy, National Advance School of Engineering of Maroua, University of Maroua, Maroua, Cameroon; Research Centre for Renewable Energy, Institute of Geological and Mining Research, Yaoundé, Cameroon
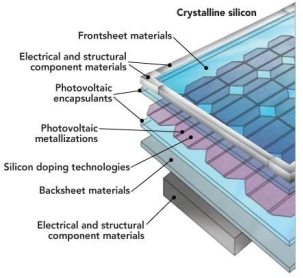
Figure 1. Sectional view of a PV module [15].
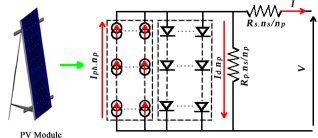
Figure 2. Module composed of n series and p parallel cells.
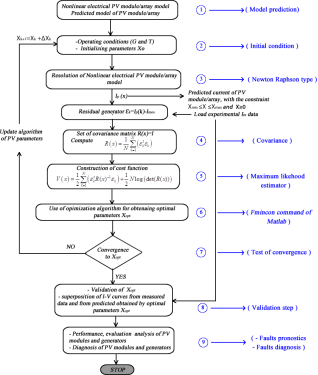
Figure 3. Flowchart algorithm of parameters extraction using MLE.
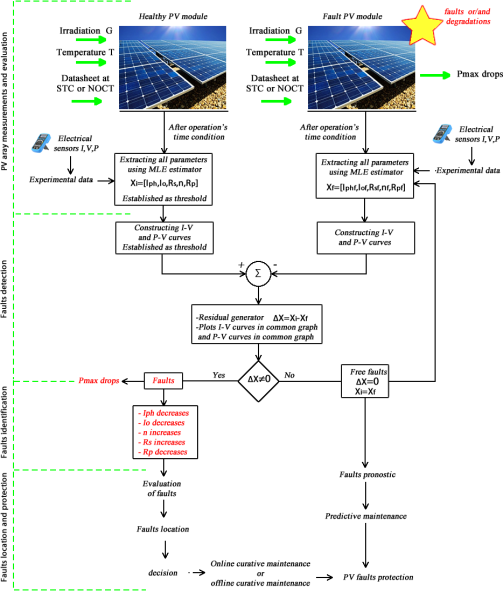
Figure 4. Monitoring and Faults diagnosis methodology based on estimated parameters of single diode PV generators.
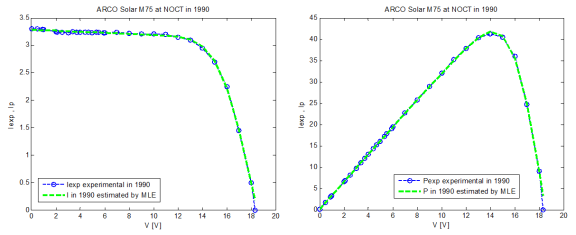
Figure 5. ARCO Solar M75 curves in 1990.
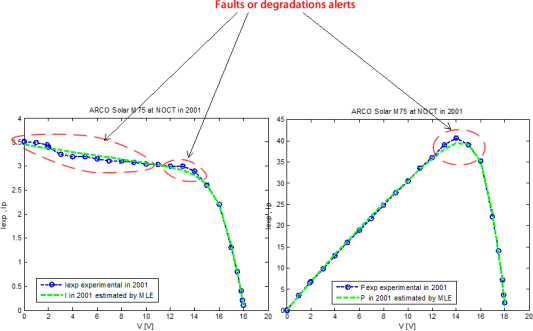
Figure 6. ARCO Solar M75 curves in 2001.
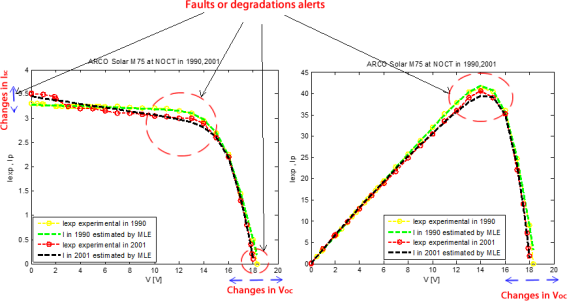
Figure 7. ARCO Solar M75 curves in 1990, 2001 in common graph.
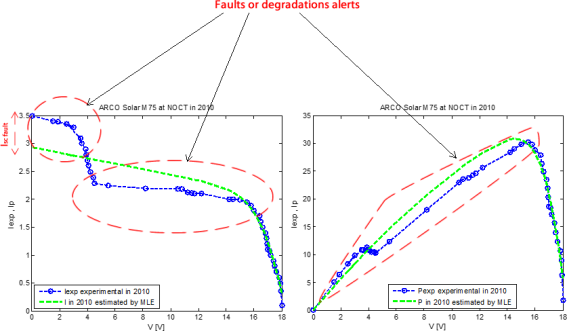
Figure 8. ARCO Solar M75 curves in 2010.
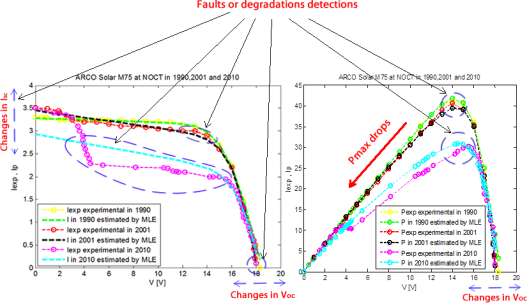
Figure 9. ARCO Solar M75 curves analysis in 1990, 2001, 2010.
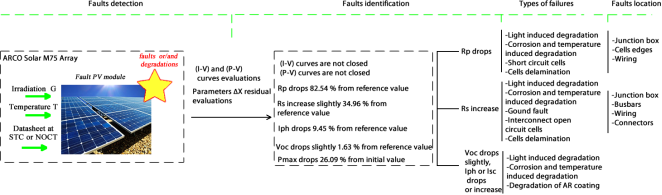
Figure 10. Types of failures and faults location in ARCO Solar M75 on study.


 ,
,  , equation
  is generally given by the manufacturer and considering (
 decreases (due to crystal damage and impurities in and near the junction…), and if
  increases (bad contact resulting from corrosion…), then
  increases as illustrated by (


 )
)
 )
)


